My Capstone Project aims to showcase the interaction between energy and healthcare, particularly energy access and reliance on clean fuels and technologies for cooking, and its role on mortality attributed to air pollution and healthy life expectancy.
Fauzia Chevonne OkedijiEnergy Access and Sustainable Development 
My Capstone Project focuses on road traffic accidents within Ghana and sub-Saharan Africa. It looks at the causes, various statistics, and approaches to correct a worrying trend.
Adu Ako-AdjeiData Science and Analytics 
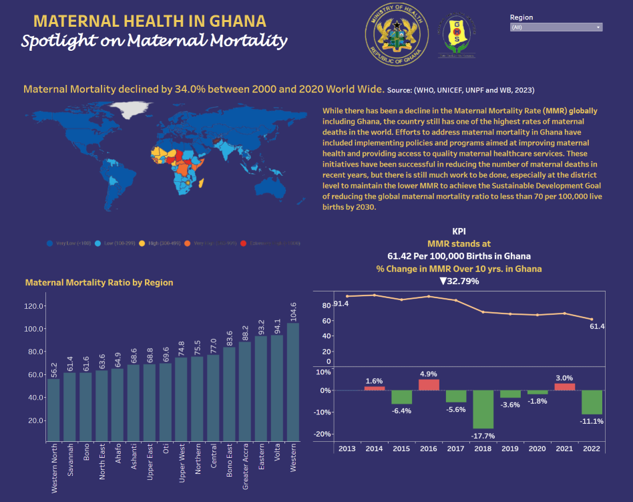
My Capstone Project examines maternal health in Ghana through an in-depth and original analysis of recent data.
Ebenezer Kingsley AmegahPublic Health